Disliked
{quote} Have you even tried using AI to create it.. ?? I copied / pasted your prompt into chatgpt and it returned this.. Took all of 30 seconds. No idea if it has bugs as I dont use MT4 and havent compiled it.. But dude, make some sort of effort, you will get a far better response from coders if you have at least tried... //+------------------------------------------------------------------+ //| CustomHistogram.mq4 | //| Generated by ChatGPT | //| | //+------------------------------------------------------------------+ #property strict // Indicator...
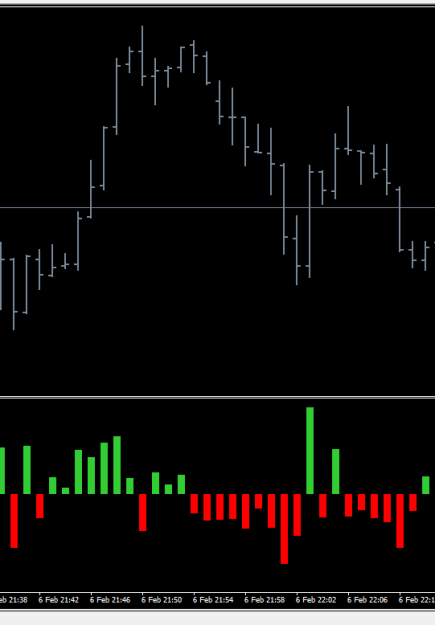
So it took another 30 seconds to fix it... the histo was backwards and all blue... here is an improved version, thanks Grok.
//+------------------------------------------------------------------+
//| UpDown Histogram - Fixed (series indexing + colors) |
//+------------------------------------------------------------------+
#property copyright "Fixed version - series indexing"
#property version "1.20"
#property strict
#property indicator_separate_window // ← This fixes the warning (separate subwindow)
#property indicator_buffers 2
#property indicator_plots 2
// Plot 1: Up bars (positive / above zero) - Green
#property indicator_label1 "Up"
#property indicator_type1 DRAW_HISTOGRAM
#property indicator_color1 clrLimeGreen
#property indicator_style1 STYLE_SOLID
#property indicator_width1 2
// Plot 2: Down bars (negative / below zero) - Red
#property indicator_label2 "Down"
#property indicator_type2 DRAW_HISTOGRAM
#property indicator_color2 clrRed
#property indicator_style2 STYLE_SOLID
#property indicator_width2 2
//--- Buffers (must be global, before any functions)
double UpBuffer[];
double DownBuffer[];
//+------------------------------------------------------------------+
//| Custom indicator initialization function |
//+------------------------------------------------------------------+
int OnInit()
{
SetIndexBuffer(0, UpBuffer);
SetIndexBuffer(1, DownBuffer);
ArraySetAsSeries(UpBuffer, true);
ArraySetAsSeries(DownBuffer, true);
SetIndexEmptyValue(0, 0.0);
SetIndexEmptyValue(1, 0.0);
IndicatorShortName("UpDown Histogram");
return(INIT_SUCCEEDED);
}
//+------------------------------------------------------------------+
//| Custom indicator iteration function |
//+------------------------------------------------------------------+
int OnCalculate(const int rates_total,
const int prev_calculated,
const datetime &time[],
const double &open[],
const double &high[],
const double &low[],
const double &close[],
const long &tick_volume[],
const long &volume[],
const int &spread[])
{
ArraySetAsSeries(open, true);
ArraySetAsSeries(high, true);
ArraySetAsSeries(low, true);
ArraySetAsSeries(close, true);
int start = (prev_calculated == 0) ? 0 : prev_calculated - 1;
for(int i = start; i < rates_total && !IsStopped(); i++)
{
UpBuffer[i] = 0.0;
DownBuffer[i] = 0.0;
double body = MathAbs(close[i] - open[i]);
double range = high[i] - low[i];
double height = range + body; // ← feel free to change to body, range, etc.
if(close[i] >= open[i]) // bullish candle
{
UpBuffer[i] = height;
}
else // bearish candle
{
DownBuffer[i] = -height;
}
}
return(rates_total);
}
//+------------------------------------------------------------------+