Trading Initial Balances
The concept of initial balance comes from market profile theory, developed by J. Peter Steidlmayer and the Chicago Board of Trade in the 1980s. The initial balance refers to the price range established during the first hour of trading (or sometimes the first 30 minutes, depending on the market). This opening period is considered significant because it represents the first opportunity for all market participants to react to overnight developments, news, and order flow. The range created during this time serves as a benchmark against which subsequent price action can be measured.
Initial balances are used as a framework for understanding market structure and potential volatility. The theory suggests that when price breaks out of the initial balance range with conviction, it often signals directional intent and can lead to trend days with extended moves. Conversely, if price remains within or keeps returning to the initial balance, it suggests a range-bound or balanced market where buyers and sellers are in relative equilibrium.
The width of the initial balance itself provides information梐 narrow range may indicate low conviction or compressed volatility that could expand later, while a wide range suggests active participation and potentially established boundaries for the session.
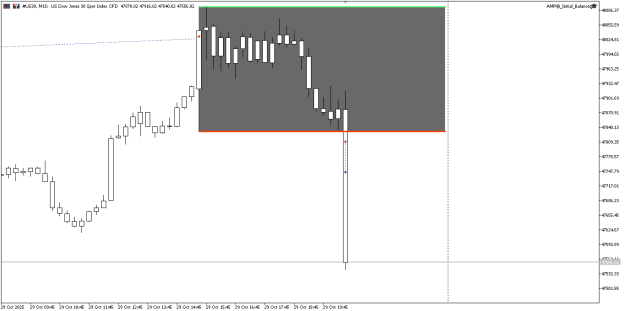
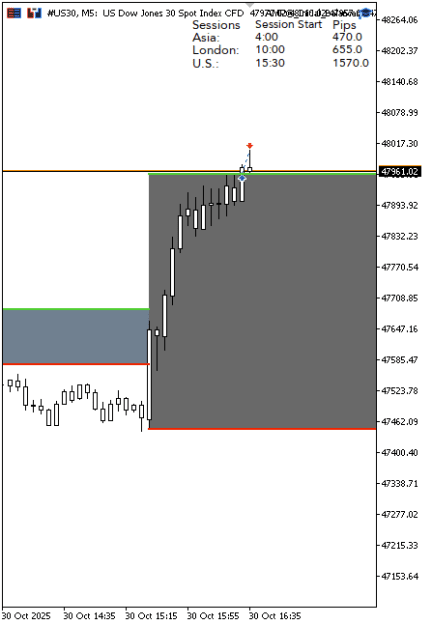
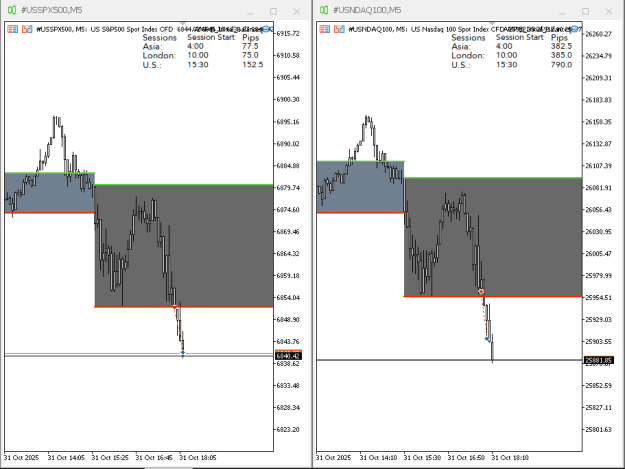
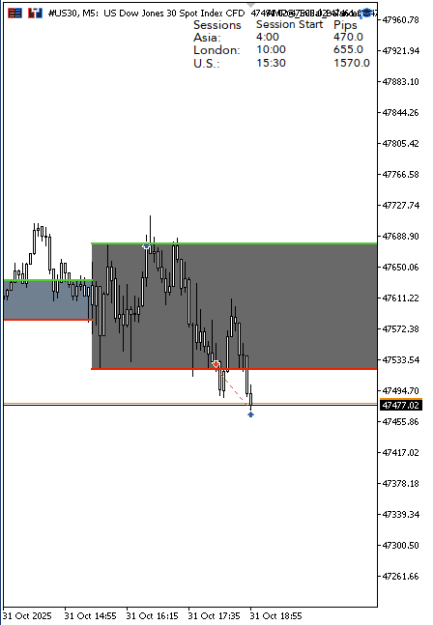
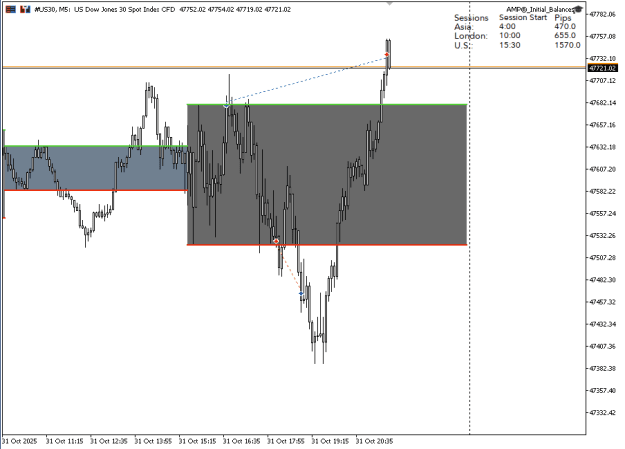
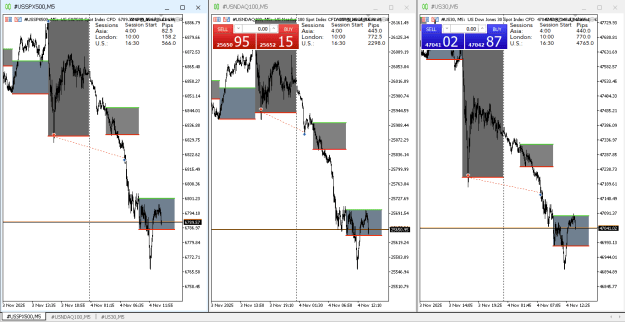
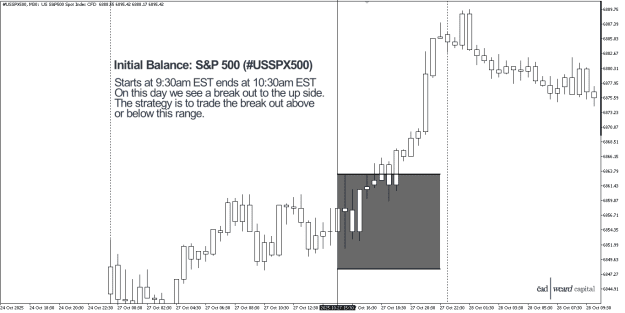
In U.S. equity markets, the initial balance is from the 9:30 AM EST market open through 10:30 AM EST, capturing the first hour of regular trading. This period includes the reaction to pre-market news, overnight developments, and the surge of liquidity from institutional participants. Initial balance extension can be used as targets, such as 1x, 2x, or 3x the width of the initial balance projected from the breakout point, as potential profit targets.
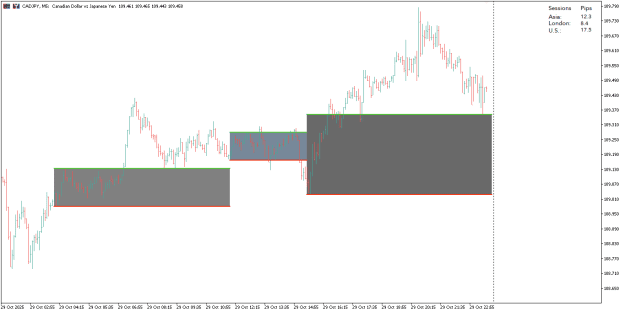
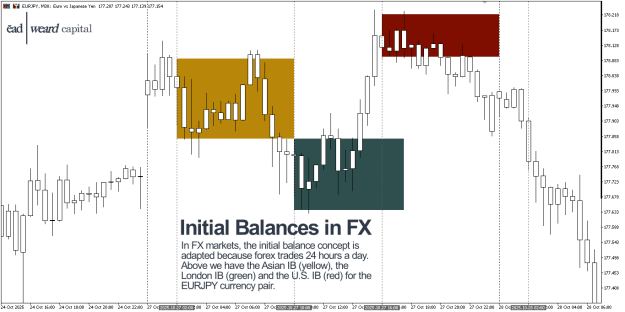
In FX markets, the initial balance concept is adapted because forex trades 24 hours a day. The initial balance can be adapted using the first hour of the London session (3:00-4:00 AM EST) or the New York session (8:00-9:00 AM EST), as these represent the beginning of major liquidity windows. The Asian session range can also be used as a reference point, watching for breakouts when European or U.S. traders enter the market. The key principle remains the same: identify the opening range of a significant trading session, then trade the breakout or fade (counter-trade) based on the strength of the move and overall market context.
Moving Forward
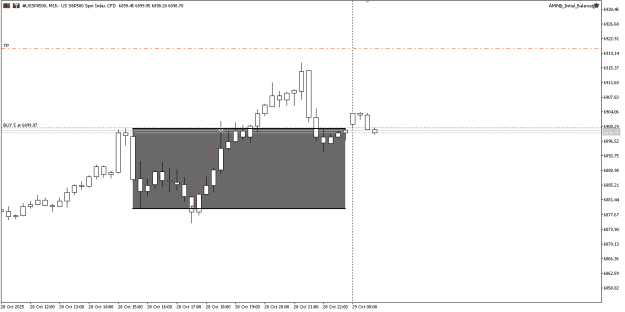
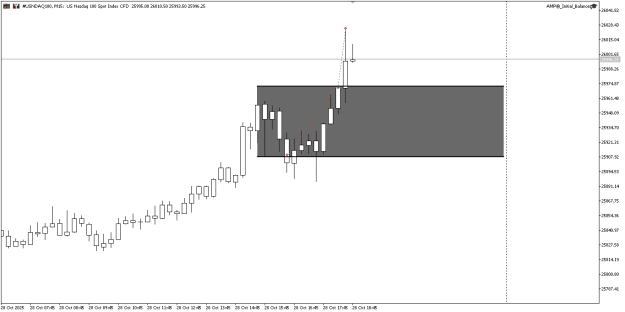
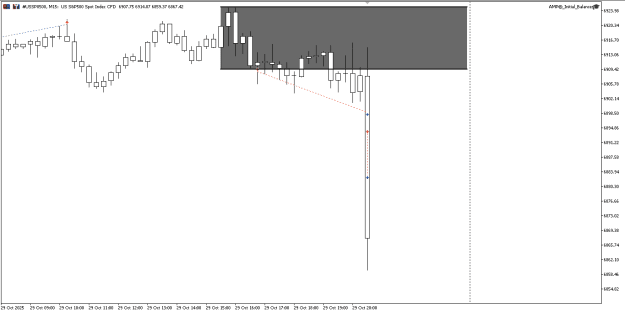
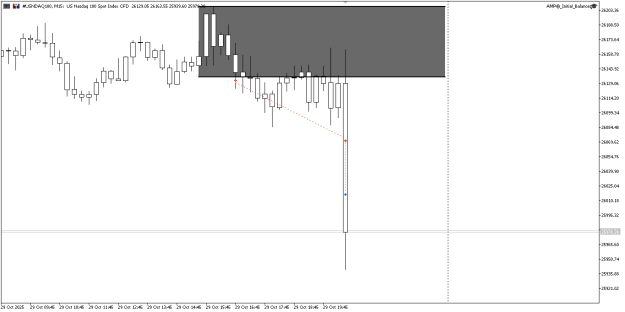
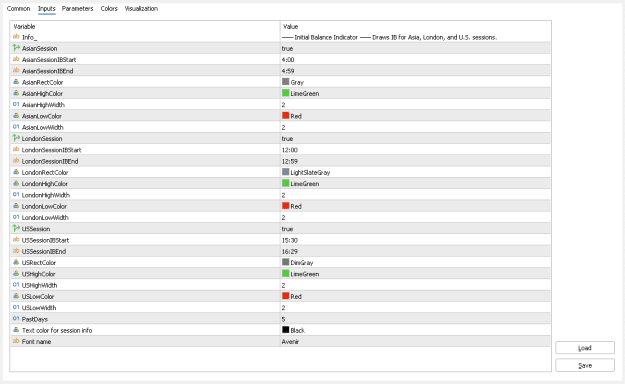
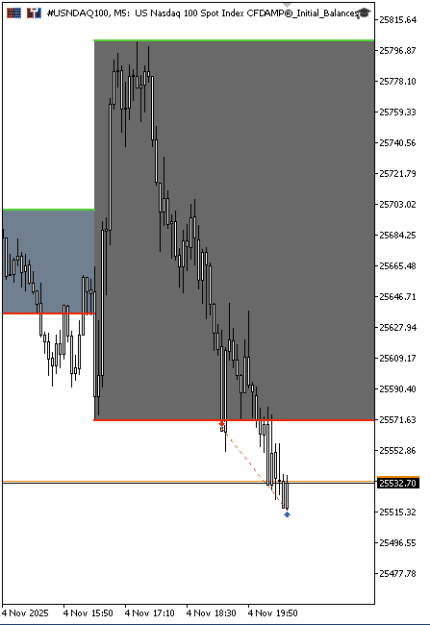
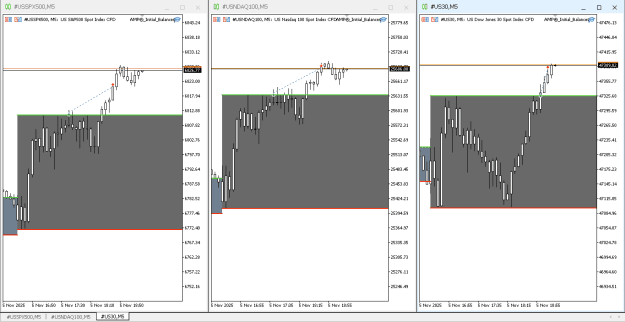
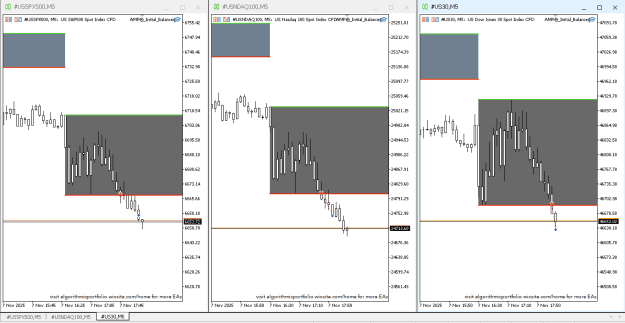
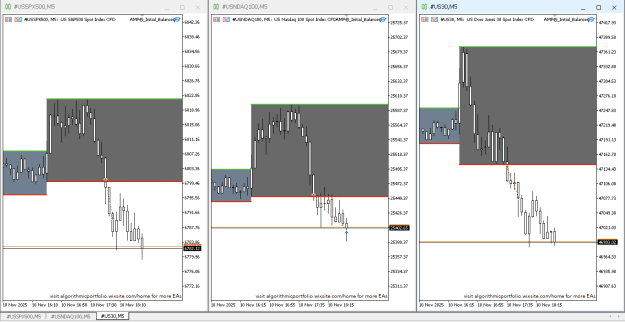
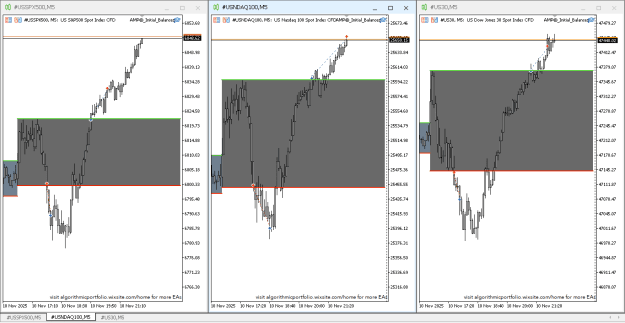
I have a Version 1.0 (it's the one that you will see in almost all of my images)of an Initial Balance indicator for MT5. I'm working on adding more details to it, but if anyone wants to help with the code and help modifying it please let me know I will be happy to share it here on this thread. As far as creating an expert advisor, I use one that I bought and don't plan on creating one soon BUT would be open to collaborate with anyone interested.
The concept of initial balance comes from market profile theory, developed by J. Peter Steidlmayer and the Chicago Board of Trade in the 1980s. The initial balance refers to the price range established during the first hour of trading (or sometimes the first 30 minutes, depending on the market). This opening period is considered significant because it represents the first opportunity for all market participants to react to overnight developments, news, and order flow. The range created during this time serves as a benchmark against which subsequent price action can be measured.
Initial balances are used as a framework for understanding market structure and potential volatility. The theory suggests that when price breaks out of the initial balance range with conviction, it often signals directional intent and can lead to trend days with extended moves. Conversely, if price remains within or keeps returning to the initial balance, it suggests a range-bound or balanced market where buyers and sellers are in relative equilibrium.
The width of the initial balance itself provides information梐 narrow range may indicate low conviction or compressed volatility that could expand later, while a wide range suggests active participation and potentially established boundaries for the session.
In U.S. equity markets, the initial balance is from the 9:30 AM EST market open through 10:30 AM EST, capturing the first hour of regular trading. This period includes the reaction to pre-market news, overnight developments, and the surge of liquidity from institutional participants. Initial balance extension can be used as targets, such as 1x, 2x, or 3x the width of the initial balance projected from the breakout point, as potential profit targets.
Attached Image (click to enlarge)
In FX markets, the initial balance concept is adapted because forex trades 24 hours a day. The initial balance can be adapted using the first hour of the London session (3:00-4:00 AM EST) or the New York session (8:00-9:00 AM EST), as these represent the beginning of major liquidity windows. The Asian session range can also be used as a reference point, watching for breakouts when European or U.S. traders enter the market. The key principle remains the same: identify the opening range of a significant trading session, then trade the breakout or fade (counter-trade) based on the strength of the move and overall market context.
Attached Image (click to enlarge)
Moving Forward
I have a Version 1.0 (it's the one that you will see in almost all of my images)of an Initial Balance indicator for MT5. I'm working on adding more details to it, but if anyone wants to help with the code and help modifying it please let me know I will be happy to share it here on this thread. As far as creating an expert advisor, I use one that I bought and don't plan on creating one soon BUT would be open to collaborate with anyone interested.