Disliked
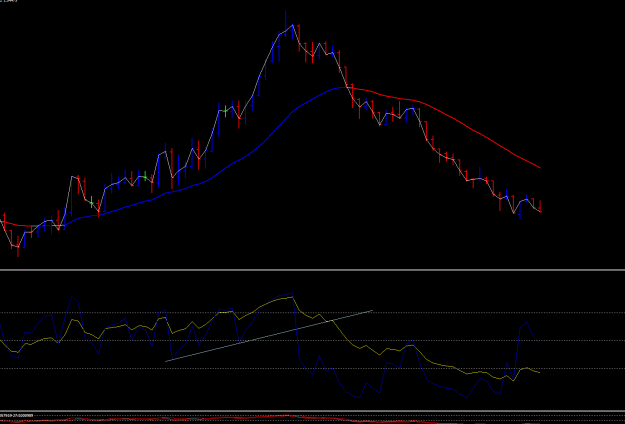
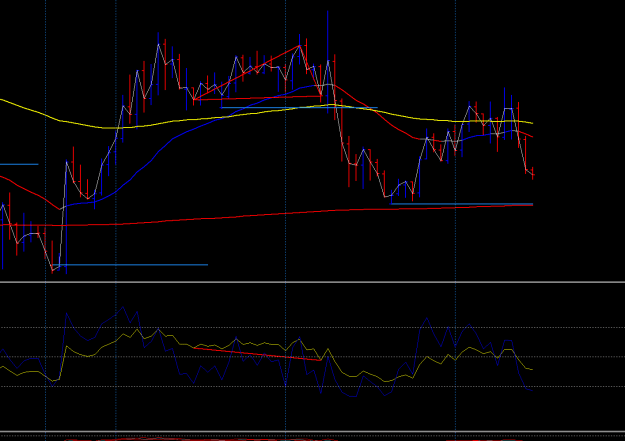
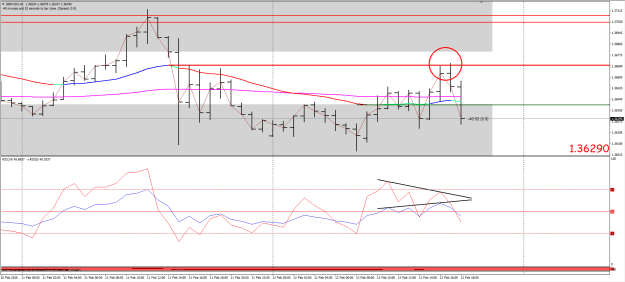
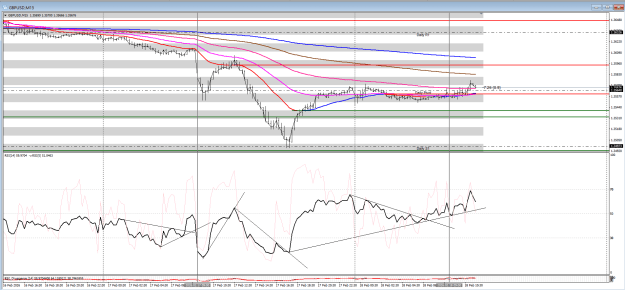
{quote} And drawing Trend channels on the M5 RSI. Notice the RSI divergence (price going down and RSI channel going up) in the middle suggesting an up move which doesn't happen, instead we get some more down move after a retest of the daily open line. How to make profits from this I am not sure unless we close the trade upon RSI divergence. {image}
Well, this is getting a little of subject here but never mind, it is something to talk about.
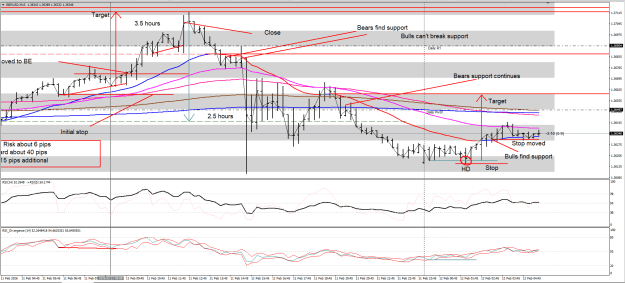
Lokk to the middle of the chart and we see the RSI channel heading up whereas the price is below the EMA heading down. Obviously, we have a divergence situation where the pull backs to the EMA should be traded as shorts.
The RSI is a difficult beast to use as an indicator unless you fully understand its meaning and trust me many have no idea but keep regurgitating the same old rubbish. One popular myth is to trade the RSI when it gets back below the 80 level or the 30 level but this is meaningless as the RSI will always gravitate back the mid-level even if both the bulls and bears are buying and selling equally but often, we may barely get our money back. It is the breaking of this mid-level or the bouncing off it that is important which is why we use the 26 EMA to note this in the price chart window.
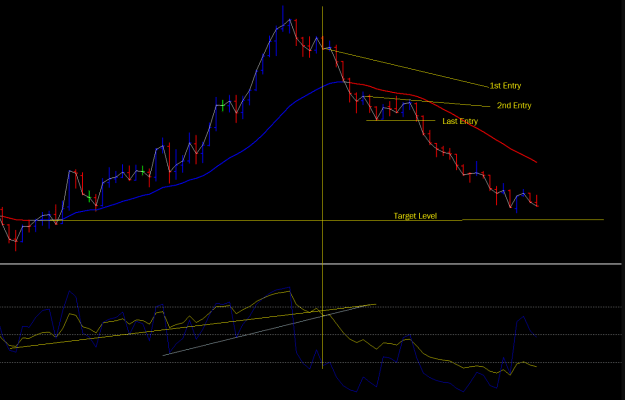
If we are taking a trade towards the average, we are gambling that it will break and find bullish or bearish support for this price action. So, we stage or stagger our entries to keep our risks low. then we are looking for the potential target being the test of the opposite side swing average.
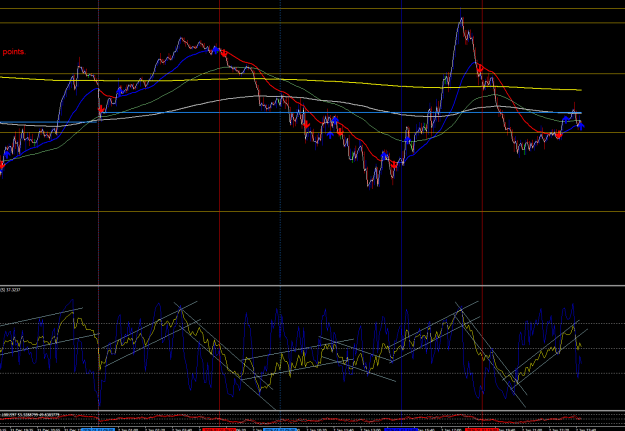
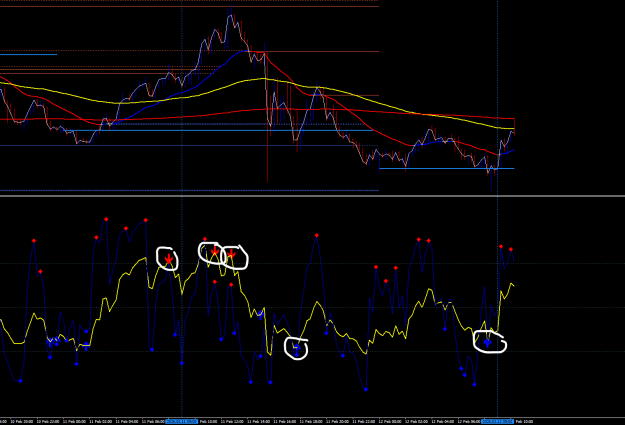
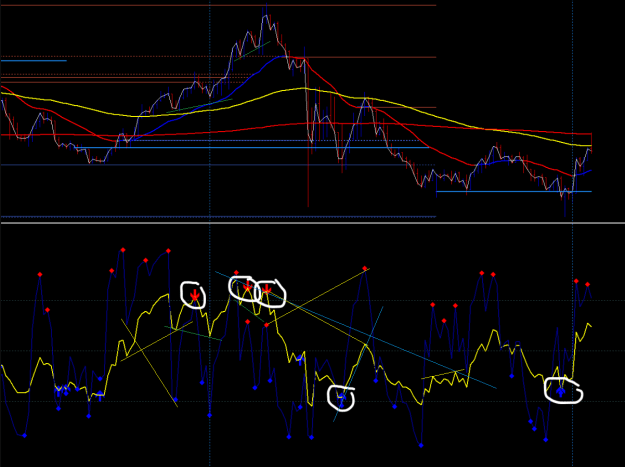
It is for these reasons I compare the RSI to the RSI and not the price. This is done on the fast/slow RSI showing us an RSI divergence.
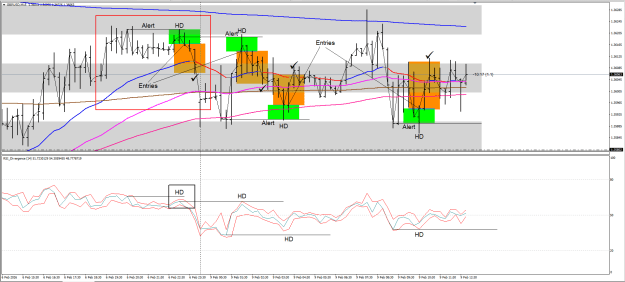
The hidden divergence is shown on the historical RSI using a pending order to catch the pull backs.
In both cases we can add to our trade as we gain more confirmation and win the maximum of the day with the smallest of risks.
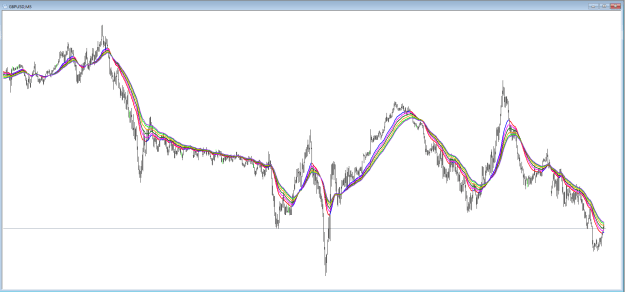
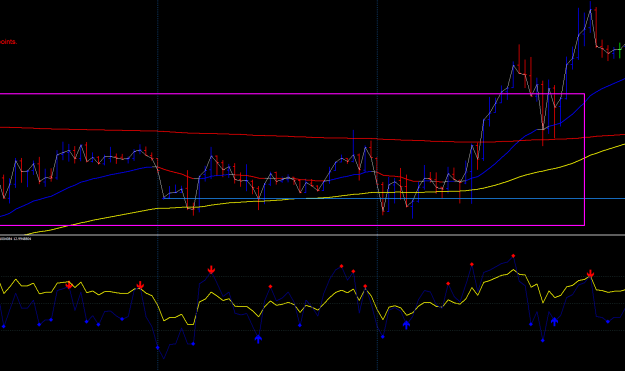
When we put multiple EMA.s of the one chart representing higher time frames we can readily see where the price is trying to get to. If we wanted to, we could put multiple RSI's say on the 5 min chart for the 5 min, 6, 7, 8, 9 and 10 min and we would form a ribbon band and see it twist as price turns. These would all still be 26EMA's for each respective time.
Here is the ribbon for the 5 min to 10 min. Note as the ribbon narrows it is an indication of a change in direction whereas as it widens it is showing some strength...
Attached Image (click to enlarge)
Many ways to set up trading systems..

Happy and prosperous New Year everyone.